Financial Indicators
| Category(Unit : KRW Million, %) | Current Quarter | Previous Quarter | QoQ (%) |
Previous Year | YoY (%) |
|
|---|---|---|---|---|---|---|
| (2023.3Q) | (2023.2Q) | (2022.3Q) | ||||
| Revenue | 3 Months | 87,656 | 101,955 | -14,299 | 99,101 | -11,445 |
| (-14.0%) | (-11.5%) | |||||
| 9 Months | 280,561 | - | - | 291,713 | -11,152 | |
| (-3.8%) | ||||||
| Operating Profit | 3 Months | 16,951 | 19,788 | -2,837 | 19,534 | -2,583 |
| (-14.3%) | (-13.2%) | |||||
| 9 Months | 50,793 | - | - | 57,749 | -6,956 | |
| (-12.0%) | ||||||
| Profit before Income Tax | 3 Months | 20,165 | 22,364 | -2,199 | 29,110 | -8,945 |
| (-9.8%) | (-30.7%) | |||||
| 9 Months | 60,766 | - | - | 77,894 | -17,128 | |
| (-22.0%) | ||||||
| Net Profit | 3 Months | 18,332 | 17,296 | +1,036 | 23,686 | -5,354 |
| (+6.0%) | (-22.6%) | |||||
| 9 Months | 50,286 | - | - | 62,055 | -11,769 | |
| (-19.0%) | ||||||
| Net Profit (loss),attributable to owners of parent | 3 Months | 17,629 | 16,911 | +718 | 23,339 | -5,710 |
| (+4.2%) | (-24.5%) | |||||
| 9 Months | 48,951 | - | - | 60,322 | -11,371 | |
| (-18.9%) | ||||||
* This is a tentative consolidated statement in accordance with the Korean International Financial Reporting Standards (K-IFRS).
Revenue and Operating Profit
| Category | 2018 | 2019 | 2020 | 2021 | 2022 | 2022. 9M | 2023. 9M |
|---|---|---|---|---|---|---|---|
| Revenue | 234,393 | 271,703 | 244,312 | 338,980 | 395,056 | 291,713 | 280,561 |
| Operating Profit | 39,355 | 42,869 | 31,581 | 65,531 | 79,638 | 57,749 | 50,793 |
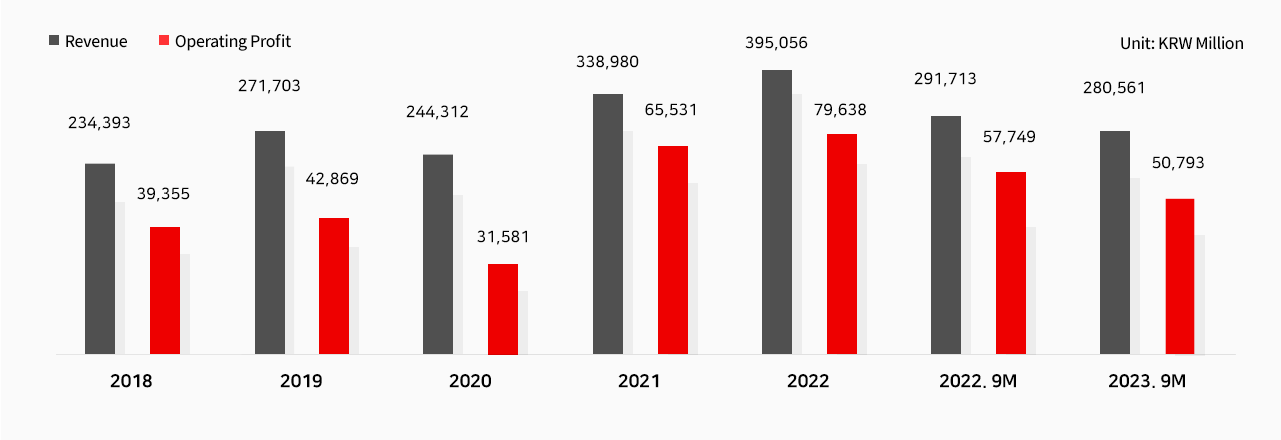
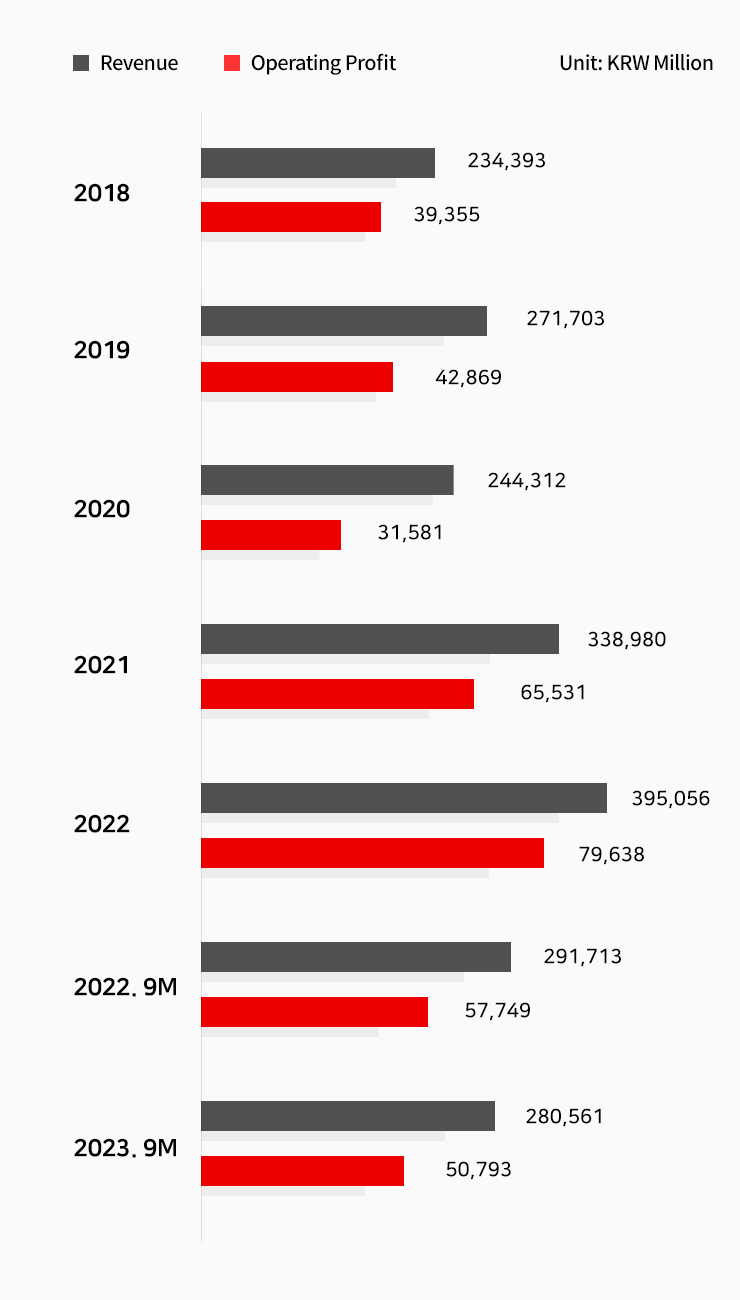
* Rayence Co., Ltd. was a consolidation company until 2016, but was excluded from consolidation in early 2017.
- Consolidated Statement of Comprehensive Income
- Consolidated Statement of Financial Position
- Consolidated Statements of Changes In Equity
- Consolidated Statement of cash flows
Consolidated Statements of Comprehensive Income
FY 2023 3Q From 01/01/2023 To 09/30/2023
FY 2022 3Q From 01/01/2022 To 09/30/2022
| Category | FY 2023 3Q | FY 2022 3Q | ||
|---|---|---|---|---|
| 3 months | 9 months | 3 months | 9 months | |
| Revenue(Sales) | 87,655,793,454 | 280,561,192,340 | 99,101,053,670 | 291,713,290,399 |
| Cost of sales | 40,604,093,189 | 132,036,174,967 | 48,373,202,417 | 145,607,018,382 |
| Gross profit | 47,051,700,265 | 148,525,017,373 | 50,727,851,253 | 146,106,272,017 |
| Selling general administrative expenses | 30,100,609,866 | 97,732,482,080 | 31,193,894,207 | 88,357,113,077 |
| Operating income(loss) | 16,951,090,399 | 50,792,535,293 | 19,533,957,046 | 57,749,158,940 |
| Other gains | 3,423,932,446 | 13,742,967,311 | 11,692,481,759 | 26,392,038,265 |
| Other losses | 3,219,095,577 | 10,288,127,106 | 7,233,761,702 | 17,712,561,474 |
| Profits of associates and joint ventures accounted for using equity method |
1,961,469,516 | 3,218,301,931 | 1,061,075,334 | 4,270,317,755 |
| Finance income | 1,779,533,058 | 5,703,898,039 | 4,311,755,388 | 8,287,157,764 |
| Finance costs | 732,400,451 | 2,403,446,361 | 255,016,980 | 1,091,766,531 |
| Profit (loss) before tax | 20,164,529,391 | 60,766,129,107 | 29,110,490,845 | 77,894,344,719 |
| Income tax expense | 1,832,996,652 | 10,480,225,405 | 5,424,868,428 | 15,839,428,976 |
| Profit (loss) | 18,331,532,739 | 50,285,903,702 | 23,685,622,417 | 62,054,915,743 |
| Profit (loss), attributable to | ||||
| Profit (loss), attributable to owners of parent | 17,628,723,904 | 48,951,064,515 | 23,338,967,665 | 60,321,573,583 |
| Profit (loss), attributable to non-controlling interests | 702,808,835 | 1,334,839,187 | 346,654,752 | 1,733,342,160 |
| Other comprehensive income | -794,364,547 | 1,596,003,813 | 4,238,110,155 | 10,527,021,111 |
| Other comprehensive income that will not be reclassified to profit or loss, net of tax | 76,036,931 | 1,596,003,813 | 4,238,110,155 | 10,527,021,111 |
| Gains (losses) on exchange differences on translation,net of tax | 51,838,696 | 1,807,768,750 | 4,254,642,072 | 10,669,942,517 |
| Share of other comprehensive income of associates and joint ventures accounted for using equity method that will be reclassified to profi or loss, net of tax | 24,198,235 | (211,764,937) | (16,531,917) | (142,921,406) |
| Other comprehensive income that will not be reclassified to profit or loss, net of tax | -870,401,478 | - | - | - |
| Share of other comprehensive income of associates and joint ventures accounted for using equity method that will not be reclassified to profit or loss, net of tax | -870,401,478 | - | - | - |
| Total comprehensive income | 17,537,168,192 | 51,881,907,515 | 27,923,732,572 | 72,581,936,854 |
| Comprehensive income attributable to | ||||
| Comprehensive income, attributable to owners of parent | 16,465,893,892 | 49,809,594,408 | 26,294,323,281 | 68,622,080,741 |
| Comprehensive income, attributable to non-controlling interests | 1,071,274,300 | 2,072,313,107 | 1,629,409,291 | 3,959,856,113 |
| Earnings per share | ||||
| Basic earnings (loss) per share (Unit : KRW) | 1,187 | 3,295 | 1,571 | 4,061 |
Consolidated Statements of Financial Position
FY 2023.3Q 09/30/2023 Current
FY 2022 12/31/2022 Current
| FY 2023 3Q | FY 2022 | |
|---|---|---|
| Assets | ||
| Current assets | 297,717,386,767 | 270,358,765,241 |
| Cash and cash equivalents | 59,396,736,638 | 70,022,717,261 |
| Short-term deposits not classified as cash equivalents | 21,635,000,000 | 19,500,000,000 |
| Short-term trade Receivable | 90,783,089,851 | 71,661,279,097 |
| Other Receivables | 1,724,347,313 | 2,001,654,482 |
| Inventories | 112,236,326,704 | 98,520,309,014 |
| Current tax assets | 1,380,434,142 | 365,581,121 |
| Current derivative asset | 26,878,046 | 493,327,157 |
| Current firm commitment asset | 939,371,340 | 761,977,771 |
| Other current assets | 9,595,202,733 | 7,031,919,338 |
| Non-current assets | 275,611,093,702 | 240,755,348,825 |
| Long-term deposits not classified as cash equivalents | 10,052,667,276 | 10,293,509,755 |
| Long-term trade receivables, gross | 17,258,406,122 | 19,169,334,548 |
| Other Non-Current Receivables | 2,270,747,197 | 2,144,548,347 |
| Investments in associates | 82,879,759,093 | 77,859,961,833 |
| Property, plant and equipment | 113,161,347,601 | 81,769,789,653 |
| Goodwill, gross | 3,577,212,308 | 3,570,895,184 |
| Intangible assets other than goodwill | 5,243,637,575 | 5,383,473,623 |
| Investment property | 11,037,829,250 | 8,615,483,973 |
| Right-of-use assets | 14,589,508,412 | 15,386,760,518 |
| Non-current firm commitment asset | 196,308,117 | 469,493,998 |
| Deferred tax assets | 14,480,550,124 | 15,264,084,557 |
| Other non-current assets | 863,120,627 | 828,012,836 |
| Total assets | 573,328,480,469 | 511,114,114,066 |
| Liabilities | ||
| Current liabilities | 99,073,832,325 | 100,870,052,358 |
| Short-term trade Payables | 43,141,177,383 | 41,445,949,215 |
| Other Payables | 18,524,873,925 | 21,052,725,941 |
| Short-term borrowings | 6,688,703,121 | 4,541,972,279 |
| Current tax liabilities | 5,155,356,963 | 12,198,264,784 |
| Current financial guarantee liabilities | 162,807,393 | 183,506,159 |
| Current derivative liabilities | 1,726,983,342 | 328,371,349 |
| Other current liabilities | 2,701,853,232 | 2,630,622,094 |
| Current lease liabilities | 4,668,607,005 | 3,006,823,069 |
| Current contract liabilities | 10,449,965,251 | 9,916,829,375 |
| Current firm commitment liabilities | 1,511,930,817 | 1,682,556,368 |
| Current provisions | 4,341,573,893 | 3,882,431,725 |
| Non-current liabilities | 60,424,683,077 | 46,810,578,556 |
| Long-term borrowings, gross | 18,128,660,342 | 6,508,993,227 |
| Non-current contract liabilities | 19,943,534,086 | 17,197,445,027 |
| Non-current firm commitment liabilities | 314,336,544 | 458,057,329 |
| Post-employment benefit obligations | 3,302,986,780 | 2,497,438,687 |
| Non-current provisions | 4,939,485,333 | 4,713,552,725 |
| Other Non-Current Payables | 2,644,947,681 | 1,939,708,786 |
| Other non-current liabilities | 176,189,658 | 186,338,062 |
| Non-current lease liabilities | 10,249,053,904 | 12,507,420,443 |
| Deferred tax liabilities | 725,488,749 | 801,624,270 |
| Total liabilities | 159,498,515,402 | 147,680,630,914 |
| Equity | ||
| Equity attributable to owners of parent | 397,604,743,362 | 349,286,169,903 |
| Issued capital of common stock | 7,427,128,000 | 7,427,128,000 |
| Share premium | 23,473,877,356 | 23,473,877,356 |
| Retained earnings before appropriations (accumulated deficit before disposition) | 382,144,132,216 | 334,678,493,301 |
| Other Comprehensive income/loss accumulated amount | 3,741,122,544 | 2,882,592,651 |
| Other capital surplus | (19,181,516,754) | (19,175,921,405) |
| Non-controlling interests | 16,225,221,705 | 14,147,313,249 |
| Total equity | 413,829,965,067 | 363,433,483,152 |
| Total equity and liabilities | 573,328,480,469 | 511,114,114,066 |
Consolidated Statements of Changes In Equity
FY 2023 3Q From 01/01/2023 To 09/30/2023
FY 2022 3Q From 01/01/2022 To 09/30/2022
| Equity | ||||||||
|---|---|---|---|---|---|---|---|---|
| Equity attributable to owners of parent | Non-controlling interest | Total equity | ||||||
| Issued capital | Capital surplus | Retained earnings | Other Comprehensive income/ loss accumulated amount |
Elements of other stockholders equity | Total of Equity attributable to owners of parent | |||
| 2022.01.01 (Equity at beginning of period) | 7,427,128,000 | 23,473,877,356 | 258,574,128,038 | 2,937,340,524 | (19,189,260,320) | 273,223,213,598 | 11,332,878,039 | 284,556,091,637 |
| Profit (loss) | 60,321,573,583 | 60,321,573,583 | 1,733,342,160 | 62,054,915,743 | ||||
| Other comprehensive income | 8,443,428,564 | 8,443,428,564 | 2,226,513,953 | 10,527,021,111 | ||||
| Changes in Affiliates' equity | (142,921,406) | (142,921,406) | (142,921,406) | |||||
| Dividends paid | (1,485,425,600) | (1,485,425,600) | (1,485,425,600) | |||||
| Increase (decrease) through changes in ownership interests in subsidiaries that do not result in loss of control | 7,706,026 | 7,706,026 | ||||||
| 2022.09.30 (Equity at end of period) | 7,427,128,000 | 23,473,877,356 | 317,410,276,021 | 11,237,847,682 | (19,189,260,320) | 340,359,868,739 | 15,300,440,178 | 355,660,308,917 |
| 2023.01.01 (Equity at beginning of period) | 7,427,128,000 | 23,473,877,356 | 334,678,493,301 | 2,882,592,651 | (19,175,921,405) | 349,286,169,903 | 14,147,313,249 | 363,433,483,152 |
| Profit (loss) | 48,951,064,515 | 48,951,064,515 | 1,334,839,187 | 50,285,903,702 | ||||
| Other comprehensive income | 1,070,294,830 | 1,070,294,830 | 737,473,920 | 1,596,003,813 | ||||
| Changes in Affiliates' equity | (211,764,937) | (211,764,937) | (211,764,937) | |||||
| Dividends paid | (1,485,425,600) | (1,485,425,600) | (1,485,425,600) | |||||
| Increase (decrease) through changes in ownership interests in subsidiaries that do not result in loss of control | (5,595,349) | (5,595,349) | 5,595,349 | |||||
| 2023.09.30 (Equity at end of period) | 7,427,128,000 | 23,473,877,356 | 382,144,132,216 | 3,741,122,544 | (19,181,516,754) | 397,604,743,362 | 16,225,221,705 | 413,829,965,067 |
Consolidated Statement of cash flows
FY 2023 3Q From 01/01/2023 To 09/30/2023
FY 2022 3Q From 01/01/2022 To 09/30/2022
| Category | FY 2023 3Q | FY 2022 3Q |
|---|---|---|
| Cash flows from (used in) operating activities | 22,633,262,118 | 15,011,072,312 |
| Cash Generated from Operation Activity | 41,081,203,651 | 38,738,544,834 |
| Interest received | 1,680,948,857 | 696,776,517 |
| Interest paid | (2,308,560,489) | (1,796,066,274) |
| Income taxes paid (refund) | (17,820,329,901) | (22,628,182,765) |
| Cash flows from (used in) investing activities | (42,914,825,731) | (23,082,916,828) |
| Proceeds from sales of property, plant and equipment | 126,857,562 | 214,805,593 |
| Proceeds from sales of intangible assets | 3,239,694 | 5,668,881 |
| Proceeds from sales of short-term loans and receivables | 63,768,023 | 39,272,822 |
| Decrease in guarantee deposits | 449,128,491 | |
| Proceeds from sales of long-term loans and receivables | 86,777,760 | 5,555,700 |
| Proceeds from government grants | 33,136,364 | 81,594,545 |
| Proceeds from sales of short term Financial Instruments | 30,235,296,381 | 25,545,191,596 |
| Proceeds from sales of long-term financial instruments | 7,171,756,791 | 1,000,000,000 |
| Dividends received | 476,482,300 | 476,482,300 |
| Purchase of short term Financial Instruments | (32,245,296,381) | (27,709,172,500) |
| Purchase of long-term financial instruments | (7,030,000,000) | (3,585,000,000) |
| Cash payments for future contracts, forward contracts, option contracts and swap contracts | (511,649,000) | (3,512,900,000) |
| Purchase of property, plant and equipment | (38,985,119,923) | (9,593,049,875) |
| Purchase of intangible assets | (44,703,310) | (60,169,469) |
| Increase in guarantee deposits | (888,882,421) | |
| Purchase of short-term loans and receivables | (14,500,483) | (2,314,000) |
| Purchase of long-term loans and receivables | (230,000,000) | (300,000,000) |
| Purchase of investments in subsidiaries, joint ventures and associates | (2,500,000,000) | (4,800,000,000) |
| Cash flows from (used in) financing activities | 7,700,003,117 | (6,696,822,575) |
| Proceeds from borrowings | 25,462,626,504 | 4,083,853,222 |
| Proceeds from changes in ownership interests in subsidiaries | 7,706,026 | |
| Repayments of borrowings | (11,907,616,277) | (5,980,723,634) |
| Payments of finance lease liabilities | (4,369,581,510) | (3,322,232,589) |
| Dividends paid | (1,485,425,600) | (1,485,425,600) |
| Net increase (decrease) in cash and cash equivalents before effect of exchange rate changes | (12,581,560,496) | (14,768,667,091) |
| Effect of exchange rate changes on cash and cash equivalents | 1,955,579,873 | 14,008,460,743 |
| Net increase (decrease) in cash and cash equivalents | (10,625,980,623) | (760,206,348) |
| Cash and cash equivalents at beginning of period | 70,022,717,261 | 86,167,956,271 |
| Cash and cash equivalents at end of period | 59,396,736,638 | 85,407,749,923 |